
Knowledge base / Helpdesk / Using the app
Reports
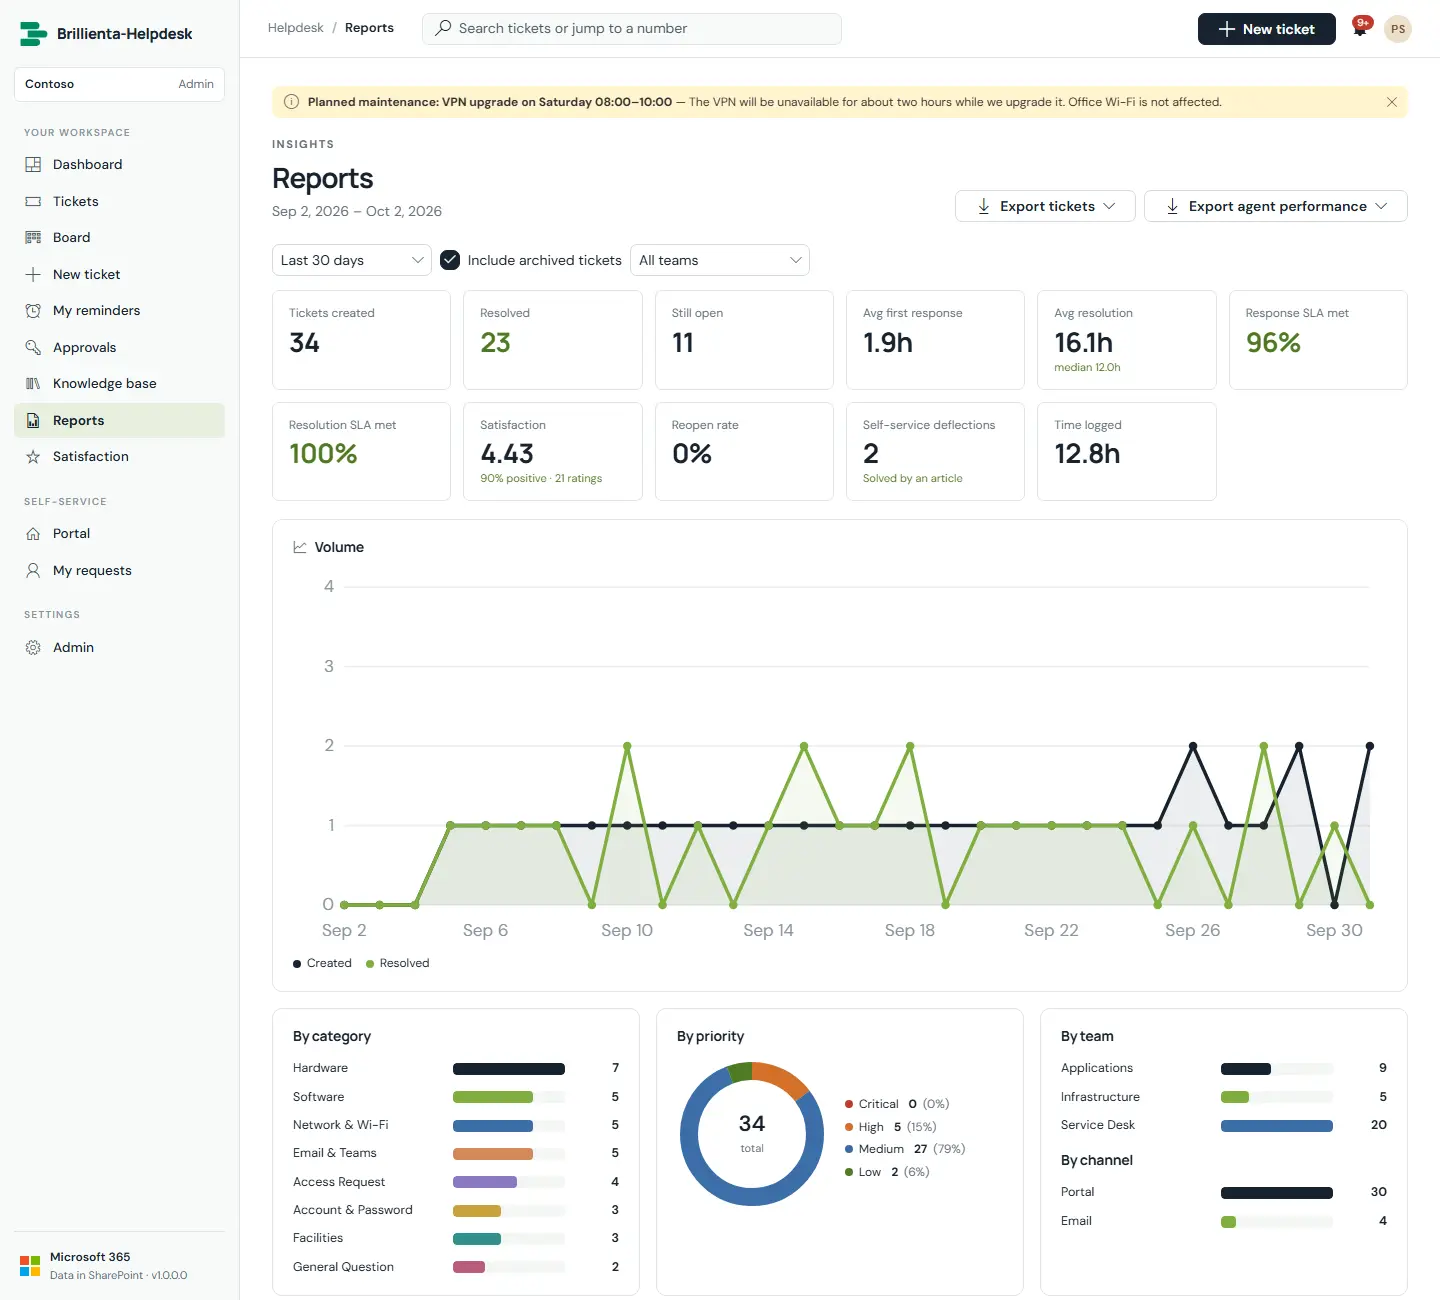
Tables and exports only (the charts live on the Dashboard), under a report cover: the period, the key figures in large type and "What stands out" in plain sentences. Tabs: Summary, SLA, Agents, Teams, Categories, Services, Requesters, Satisfaction, Backlog, Ticket list.
How it works
- Date ranges, team filter, optional archived tickets. Every section exports to Excel or PDF; Export full report writes one workbook or one PDF.
- Excel keeps real dates and numbers with filters; PDFs are A4 with page numbers (max 3,000 rows).
Still need help?Our team answers product questions by email, and we can walk you through it on a call.
Open in the full guideContact support