
Knowledge base / Helpdesk / Using the app
Dashboard
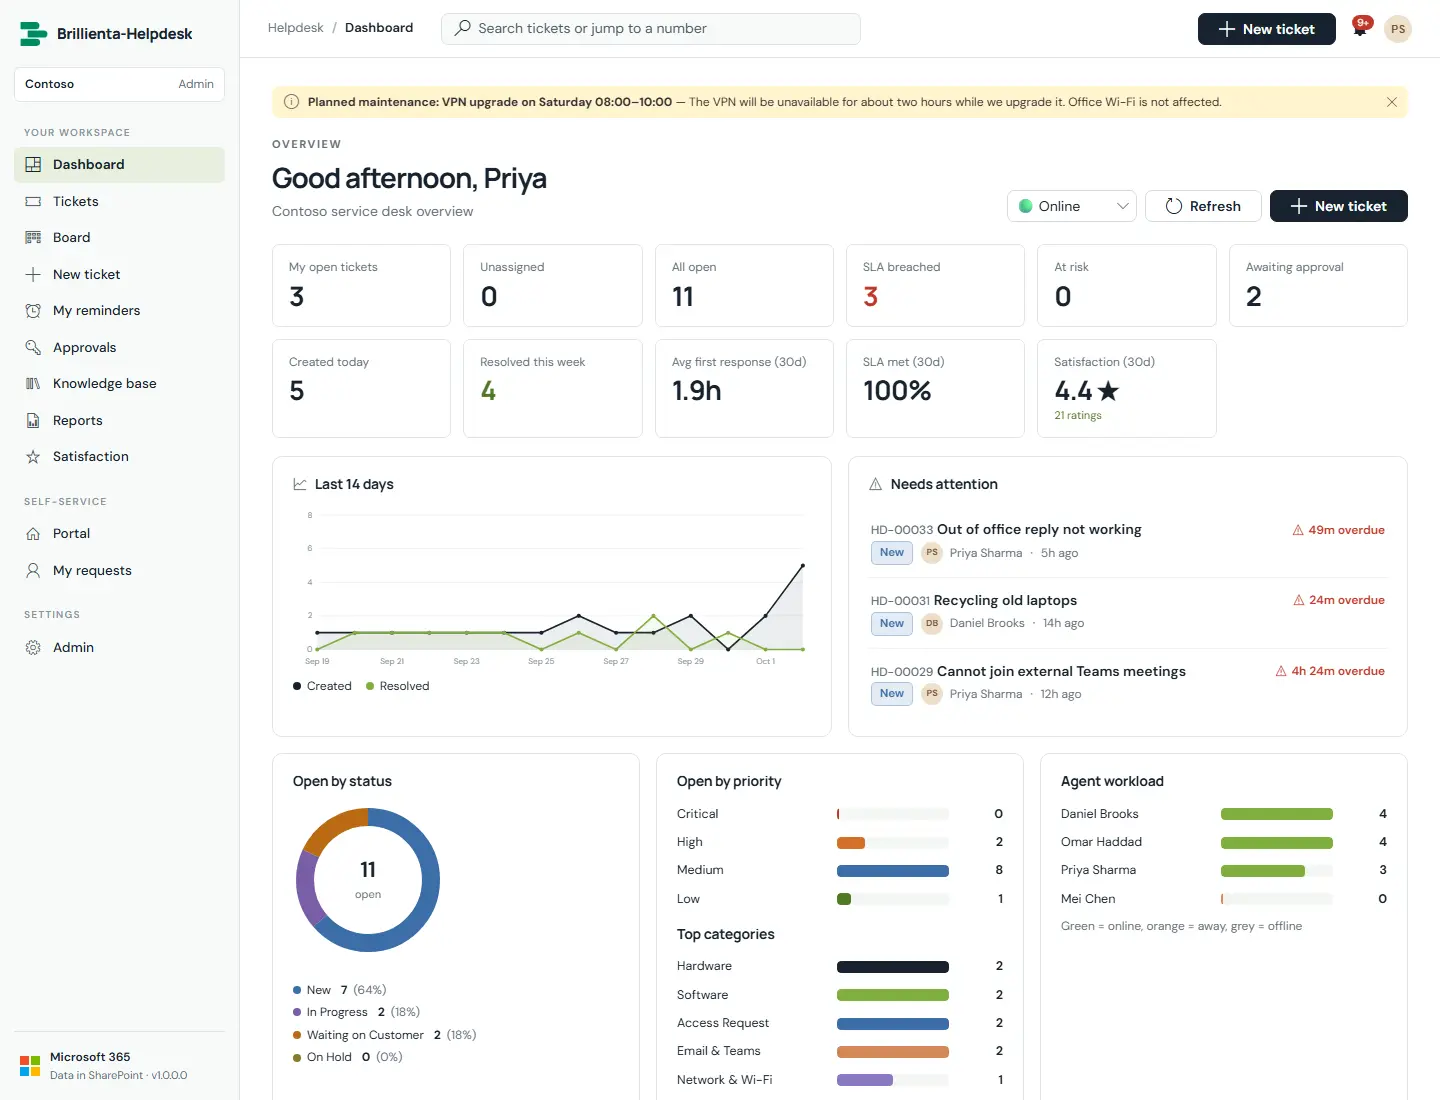
All the charts, in tabs, under a navy band with highlights: the few things worth knowing first, in plain sentences, each opening where to look closer. Key figures are clickable and open the matching tickets.
How it works
- Tabs: Today, Trends, SLA, Agents & teams, Categories & services, Requesters, Satisfaction, Backlog — each compared with the previous equal-length period.
- Agents set their availability (online, away, offline), which automatic assignment respects.
- Export any view to Excel or PDF.
Still need help?Our team answers product questions by email, and we can walk you through it on a call.
Open in the full guideContact support