
Knowledge base / TaskManager / Using the app
Dashboard
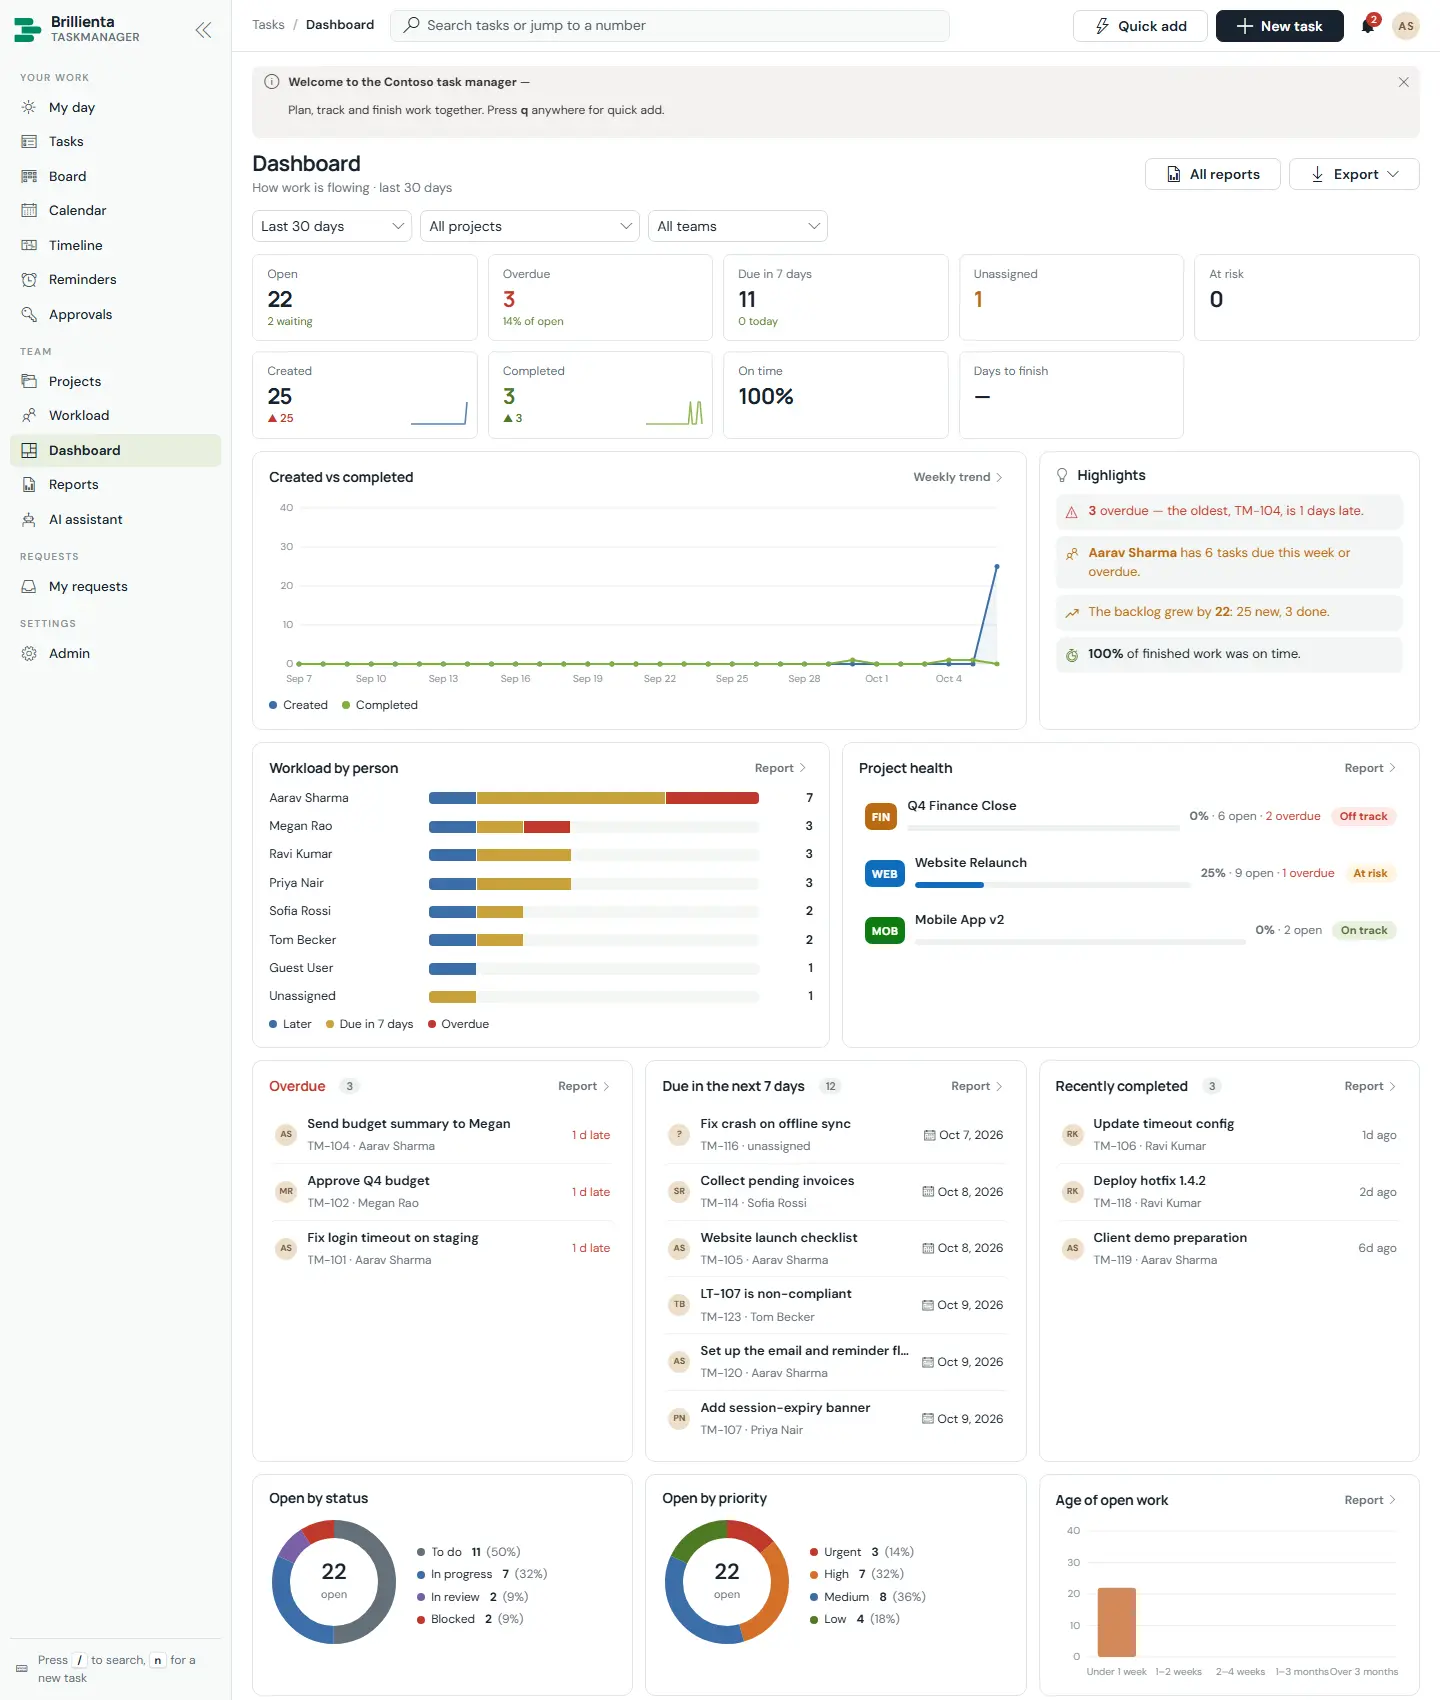
The executive overview: KPIs with change against the previous period (open, overdue, due soon, unassigned, at risk, created, completed, on-time %, days to finish), plain-language highlights that jump to the right list, created-vs-completed, workload by person, project health, overdue / due-soon / recently-completed lists, open by status, priority and category, age of open work, on-time by priority, most completed and time by person and project. Filter by 7 / 30 / 90 days, project and team; export everything.
Still need help?Our team answers product questions by email, and we can walk you through it on a call.
Open in the full guideContact support